Note
Click here to download the full example code
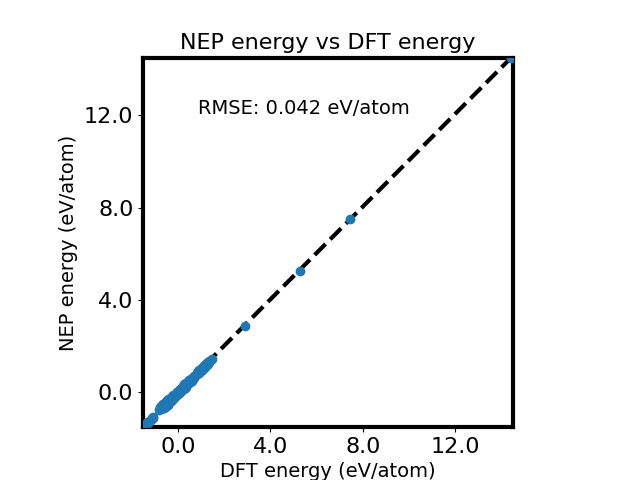
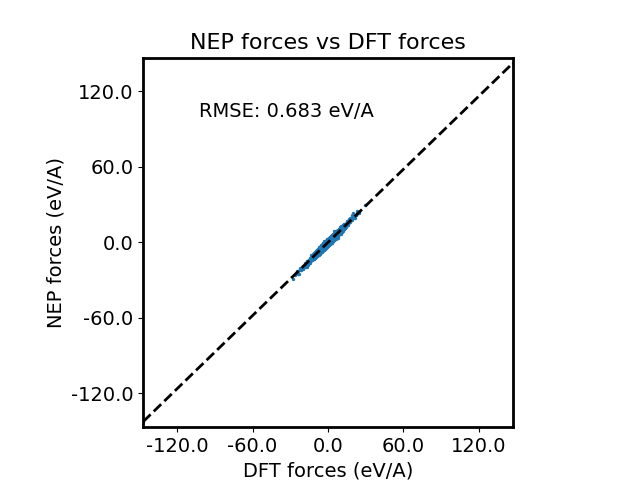
NEP vs DFT results
This example show how to calculate energy, forces and stress of structures and compare them with DFT results
NEP 3 calculator with 1 symbols: C
------------------------------
  zbl                 : False
  radial_cutoff       : 4.199999809265137
  angular_cutoff      : 3.700000047683716
  n_max_radial        : 10
  n_max_angular       : 8
  basis_size_radial   : 10
  basis_size_angular  : 8
  l_max_3body         : 4
  l_max_4body         : 2
  l_max_5body         : 1
  num_node            : 65
  num_para            : 6903
  element_list        : ['C']
------------------------------


<Figure size 640x480 with 1 Axes>
from pynep.calculate import NEP
from ase.io import read
import numpy as np
import matplotlib.pyplot as plt
import matplotlib.ticker as ticker


def plot_e(ed, er):
    fig = plt.figure()
    # plt.xticks(fontname="Arial", weight='bold')
    plt.title("NEP energy vs DFT energy", fontsize=16)
    ed = ed - np.mean(ed)
    er = er - np.mean(er)
    ax = plt.gca()
    ax.set_aspect(1)
    xmajorLocator = ticker.MaxNLocator(5)
    ymajorLocator = ticker.MaxNLocator(5)
    ax.xaxis.set_major_locator(xmajorLocator)
    ax.yaxis.set_major_locator(ymajorLocator)

    ymajorFormatter = ticker.FormatStrFormatter('%.1f')
    xmajorFormatter = ticker.FormatStrFormatter('%.1f')
    ax.xaxis.set_major_formatter(xmajorFormatter)
    ax.yaxis.set_major_formatter(ymajorFormatter)

    ax.set_xlabel('DFT energy (eV/atom)', fontsize=14)
    ax.set_ylabel('NEP energy (eV/atom)', fontsize=14)

    ax.spines['bottom'].set_linewidth(3)
    ax.spines['left'].set_linewidth(3)
    ax.spines['right'].set_linewidth(3)
    ax.spines['top'].set_linewidth(3)
    ax.tick_params(labelsize=16)


    plt.plot([np.min(ed), np.max(ed)], [np.min(er), np.max(er)],
            color='black',linewidth=3,linestyle='--',)
    plt.scatter(ed, er, zorder=200)

    m1 = min(np.min(ed), np.min(er))
    m2 = max(np.max(ed), np.max(er))
    ax.set_xlim(m1, m2)
    ax.set_ylim(m1, m2)

    rmse = np.sqrt(np.mean((ed-er)**2))
    plt.text(np.min(ed) * 0.85 + np.max(ed) * 0.15,
             np.min(er) * 0.15 + np.max(ed) * 0.85,
             "RMSE: {:.3f} eV/atom".format(rmse), fontsize=14)
    plt.savefig('e.png')
    return fig


def plot_f(fd, fr):
    fig = plt.figure()
    ax = plt.gca()
    plt.title("NEP forces vs DFT forces", fontsize=16)
    ax.set_aspect(1)
    xmajorLocator = ticker.MaxNLocator(5)
    ymajorLocator = ticker.MaxNLocator(5)
    ax.xaxis.set_major_locator(xmajorLocator)
    ax.yaxis.set_major_locator(ymajorLocator)

    ymajorFormatter = ticker.FormatStrFormatter('%.1f')
    xmajorFormatter = ticker.FormatStrFormatter('%.1f')
    ax.xaxis.set_major_formatter(xmajorFormatter)
    ax.yaxis.set_major_formatter(ymajorFormatter)

    ax.set_xlabel('DFT forces (eV/A)', fontsize=14)
    ax.set_ylabel('NEP forces (eV/A)', fontsize=14)

    ax.spines['bottom'].set_linewidth(2)
    ax.spines['left'].set_linewidth(2)
    ax.spines['right'].set_linewidth(2)
    ax.spines['top'].set_linewidth(2)

    ax.tick_params(labelsize=14)

    ax.set_xlim(np.min(fd), np.max(fd))
    ax.set_ylim(np.min(fr), np.max(fr))

    plt.plot([np.min(fd), np.max(fd)], [np.min(fr), np.max(fr)],
            color='black',linewidth=2,linestyle='--')
    plt.scatter(fd.reshape(-1), fr.reshape(-1), s=2)

    m1 = min(np.min(fd), np.min(fr))
    m2 = max(np.max(fd), np.max(fr))
    ax.set_xlim(m1, m2)
    ax.set_ylim(m1, m2)

    rmse = np.sqrt(np.mean((fd-fr)**2))
    plt.text(np.min(fd) * 0.85 + np.max(fd) * 0.15,
             np.min(fr) * 0.15 + np.max(fr) * 0.85,
             "RMSE: {:.3f} eV/A".format(rmse), fontsize=14)
    plt.savefig('f.png')
    return fig

a = read('data.traj', ':')
calc = NEP("C_2022_NEP3.txt")
print(calc)
e1, e2, f1, f2 = [], [], [], []
for i in a:
    i.set_calculator(calc)
    e1.append(i.get_potential_energy() / len(i))
    e2.append(i.info['energy'] / len(i))
    f1.append(i.get_forces().reshape(-1))
    f2.append(i.info['forces'].reshape(-1))
e1 = np.array(e1)
e2 = np.array(e2)
f1 = np.concatenate(f1)
f2 = np.concatenate(f2)
plot_e(e2, e1)
plot_f(f2, f1)
Total running time of the script: ( 0 minutes 3.557 seconds)